
Archivo:SDSPAGE.png
SDSPAGE.png (417 × 362 píxeles; tamaño de archivo: 64 kB; tipo MIME: image/png)
From English Wikipedia: http://en.wikipedia.org/w/index.php?title=Image:SDSPAGE.png&action=edit
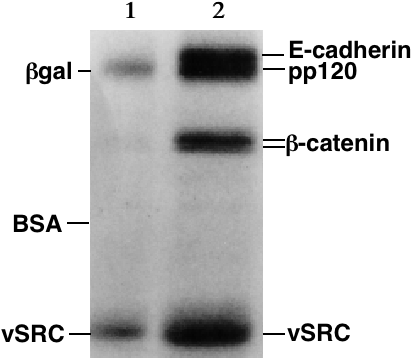
Example of SDS-PAGE of proteins visualized by autoradiography. Two radioactively labeled protein samples were run in adjacent lanes of the gel (1, 2). The larger proteins (β-galactosidase size standard, marker, E-cadherin cell-to-cell adhesion protein, pp120) are towards the top of the gel and smaller proteins (vSRC tyrosine-specific protein kinase, 60,000 Da) are towards the bottom. As its name implies, pp120 is a 120,000 Da phosphoprotein. The β-galactosidase and bovine serum albumin (BSA) size standards were in an adjacent lane (not shown). The radioactive label was 32Phosphate from the gamma position phosphate group of ATP. The vSRC protein is an oncogene that disrupts cell growth by its phosphorylation of other proteins such as β-catenin, a protein that links E-cadherin to the cell's cytoskeleton. In this experiment, the vSRC protein auto-phosphorylated itself and the other proteins (E-cadherin, pp120 and β-catenin). After electrophoresis, medical X-ray film was exposed to the dried gel and regions of dark exposure of the film (the "bands") indicate the position of the radioactively-labeled proteins. Lane 1 is a negative control for which no vSRC was added to the labeling reaction. The other proteins (E-cadherin, pp120 and β-catenin) came from an immunoprecipitation of E-cadherin with anti-E-cadherin antibody. The pp120 and β-catenin proteins exist in a molecular complex with E-cadherin at the surface of the cell and they co-precipitate with E-cadherin. Some cSRC kinase probably also co-precipitated with the E-cadherin, accounting for the faint bands in lane 1. The vSRC kinase was immunoprecipitated from mouse NIH-3T3 cells that had been genetically engineered to express this chicken-derived oncogene. The E-cadherin was from mouse P19 embryonal carcinoma cells. (this picture was worth 290 words)
Uploaded for use on the Gel electrophoresis page.
Source: my personal image.
The copyright to this image is retained by John Schmidt (JWSchmidt).
Permission is granted to copy, distribute and/or modify this image under the terms of the Wikipedia GFDL, as indicated in the fine print at the bottom of this page.
| Este archivo se encuentra bajo la licencia Creative Commons Genérica de Atribución/Compartir-Igual 3.0. Sujeto a disclaimer. | ||
| Atribución: JWSchmidt de la Wikipedia en inglés | ||
| ||
| Esta etiqueta de licencia fue agregada a este archivo como parte de la actualización de la licencia GFDL. |

|
Se autoriza la copia, distribución y modificación de este documento bajo los términos de la licencia de documentación libre GNU, versión 1.2 o cualquier otra que posteriormente publique la Fundación para el Software Libre; sin secciones invariables, textos de portada, ni textos de contraportada. Se incluye una copia de la dicha licencia en la sección titulada Licencia de Documentación Libre GNU. Sujeto a disclaimer. |
If you do not want to use this image under the terms of the GFDL, you can alternatively use it under the terms of the cc-by-nc-sa license.
Historial del archivo
Haz clic sobre una fecha y hora para ver el archivo tal como apareció en ese momento.
| Fecha y hora | Miniatura | Dimensiones | Usuario | Comentario | |
|---|---|---|---|---|---|
| actual | 15:10 1 ene 2006 | | 417 × 362 (64 kB) | Llull~commonswiki | From English Wikipedia: http://en.wikipedia.org/w/index.php?title=Image:SDSPAGE.png&action=edit Example of SDS-PAGE of proteins visualized by autoradiography. Two radioactively labeled protein samples were run in adjacent lanes of the gel (1, 2). The la |
Usos del archivo
Las siguientes páginas usan este archivo:
Uso global del archivo
Las wikis siguientes utilizan este archivo:
- Uso en ca.wikipedia.org
- Uso en en.wikipedia.org
- Uso en en.wikibooks.org
- Uso en gl.wikipedia.org
- Uso en ja.wikipedia.org
- Uso en ms.wikipedia.org
- Uso en zh.wikipedia.org